
Abstract
This paper applies the Nash-Markov AI (NMAI) equilibrium framework to analyse the rhetorical architecture employed by NVIDIA Corporation and its CEO, Jensen Huang. NVIDIA expressly describes AI data centres as active "AI factories" and has separately stated that data is a raw material.
The NMAI finding is therefore not that processing or data are never named. It is that the dominant value narrative follows energy, compute and tokens while leaving the provenance, rights, lawful basis and value allocation of source data outside the account.
The paper therefore separates data kept under the originating controller's custody from data farmed through access, extraction, aggregation, transformation, inference, derivative creation or secondary reuse. It defines data sovereignty as continuing legal, operational and economic control over both source data and everything derived from it; domestic server location alone is not sovereignty. Through quantitative analysis of NVIDIA's financial statements (Q1 FY2026–Q1 FY2027), we interpret 60–71% net margins, against the case-study reference band, as evidence consistent with exceptional market power rather than ordinary competitive equilibrium.
The NMAI Equilibrium Score is 0.57 (Drifting), with a reproducible visible-channel Signal Integrity score of 0.23/1.0 – indicating severe structural incompleteness.
1. The Core Displacement: Processing Without Provenance
"Data centre" is inherited infrastructure terminology; it does not mean that data is only stored. Huang explicitly rejects the old storage-only image and describes AI data centres as factories that generate tokens. The analytical issue is therefore the boundary of the production account. Energy, compute and token output are made visible, while the provenance, rights, lawful basis and economic participation of the underlying data sources are not carried through the same value narrative.
1.1 Data Kept, Data Processed and Data Farmed Are Different States
A data centre names the infrastructure. A data farm names what the infrastructure does. A data centre stores and processes information; it becomes a data farm when its operating model systematically harvests data or derived information as a productive resource. The same facility can be both. Calling it a data centre says nothing about whether the data is sovereign, because location does not disclose access, purpose, reuse, derivatives or control.
The central distinction is functional. A system may keep an original dataset in the institution that collected it while allowing another organisation or remote service to read, transform and learn from it. In that case, the source record has been kept locally, but its informational and economic value may still have been farmed. These categories are therefore not interchangeable:
| State | What it means | What it does not prove |
|---|---|---|
| Data kept | The original records remain stored within the originating institution's controlled system and retention boundary. | It does not prove that nobody outside that boundary can access, query, copy, infer from or economically reuse them. |
| Data processed | Compute reads or transforms data for a defined operation, such as a search, calculation, model training run, inference or workflow. | Processing may be local or remote, temporary or persistent, sovereign or non-sovereign. The word alone answers none of those questions. |
| Data exported | Data is copied, transmitted, mirrored or made accessible beyond the originating legal or operational boundary. | Export is one route by which data may be farmed, but farming does not require the original database itself to be physically moved. |
| Data farmed | Data or its informational value is systematically harvested, combined, transformed or reused to produce models, profiles, predictions, synthetic data, tokens, services or commercial advantage beyond the originating task. | The term describes the operating and economic function. Whether a particular instance is lawful depends on its evidence, purpose, authority, contracts, transparency and applicable law. |
The data being farmed is wider than the source file. It can include raw records; copied subsets and working files; prompts and responses; access and usage metadata; telemetry; labels; embeddings and vector indexes; inferred attributes and profiles; model gradients, fine-tuning changes and weights; synthetic datasets; and the downstream tokens, analytics or decisions produced from those inputs. Deleting or retaining the original record therefore does not, by itself, account for the derivative data and model effects already created.
1.2 What Data Sovereignty Means in This Paper
Data sovereignty is not the physical location of a server. It is the continuing ability of the originating polity, institution and lawful controller to determine, enforce and independently verify the complete data lifecycle. This includes where source data and derivatives reside; which jurisdiction can compel access; who can access them; the permitted purpose; whether they may be combined, exported, retained, used for training or reused for another product; how they are audited, corrected and deleted; whether the system can be moved to another supplier; and who retains the economic value created from them.
A facility can be physically located in the United Kingdom and still operate as a data farm for an external provider. Conversely, keeping raw records inside a local database does not preserve sovereignty if remote access, provider-controlled processing, telemetry, model learning or derivative retention places effective control and reusable value outside the originating system.
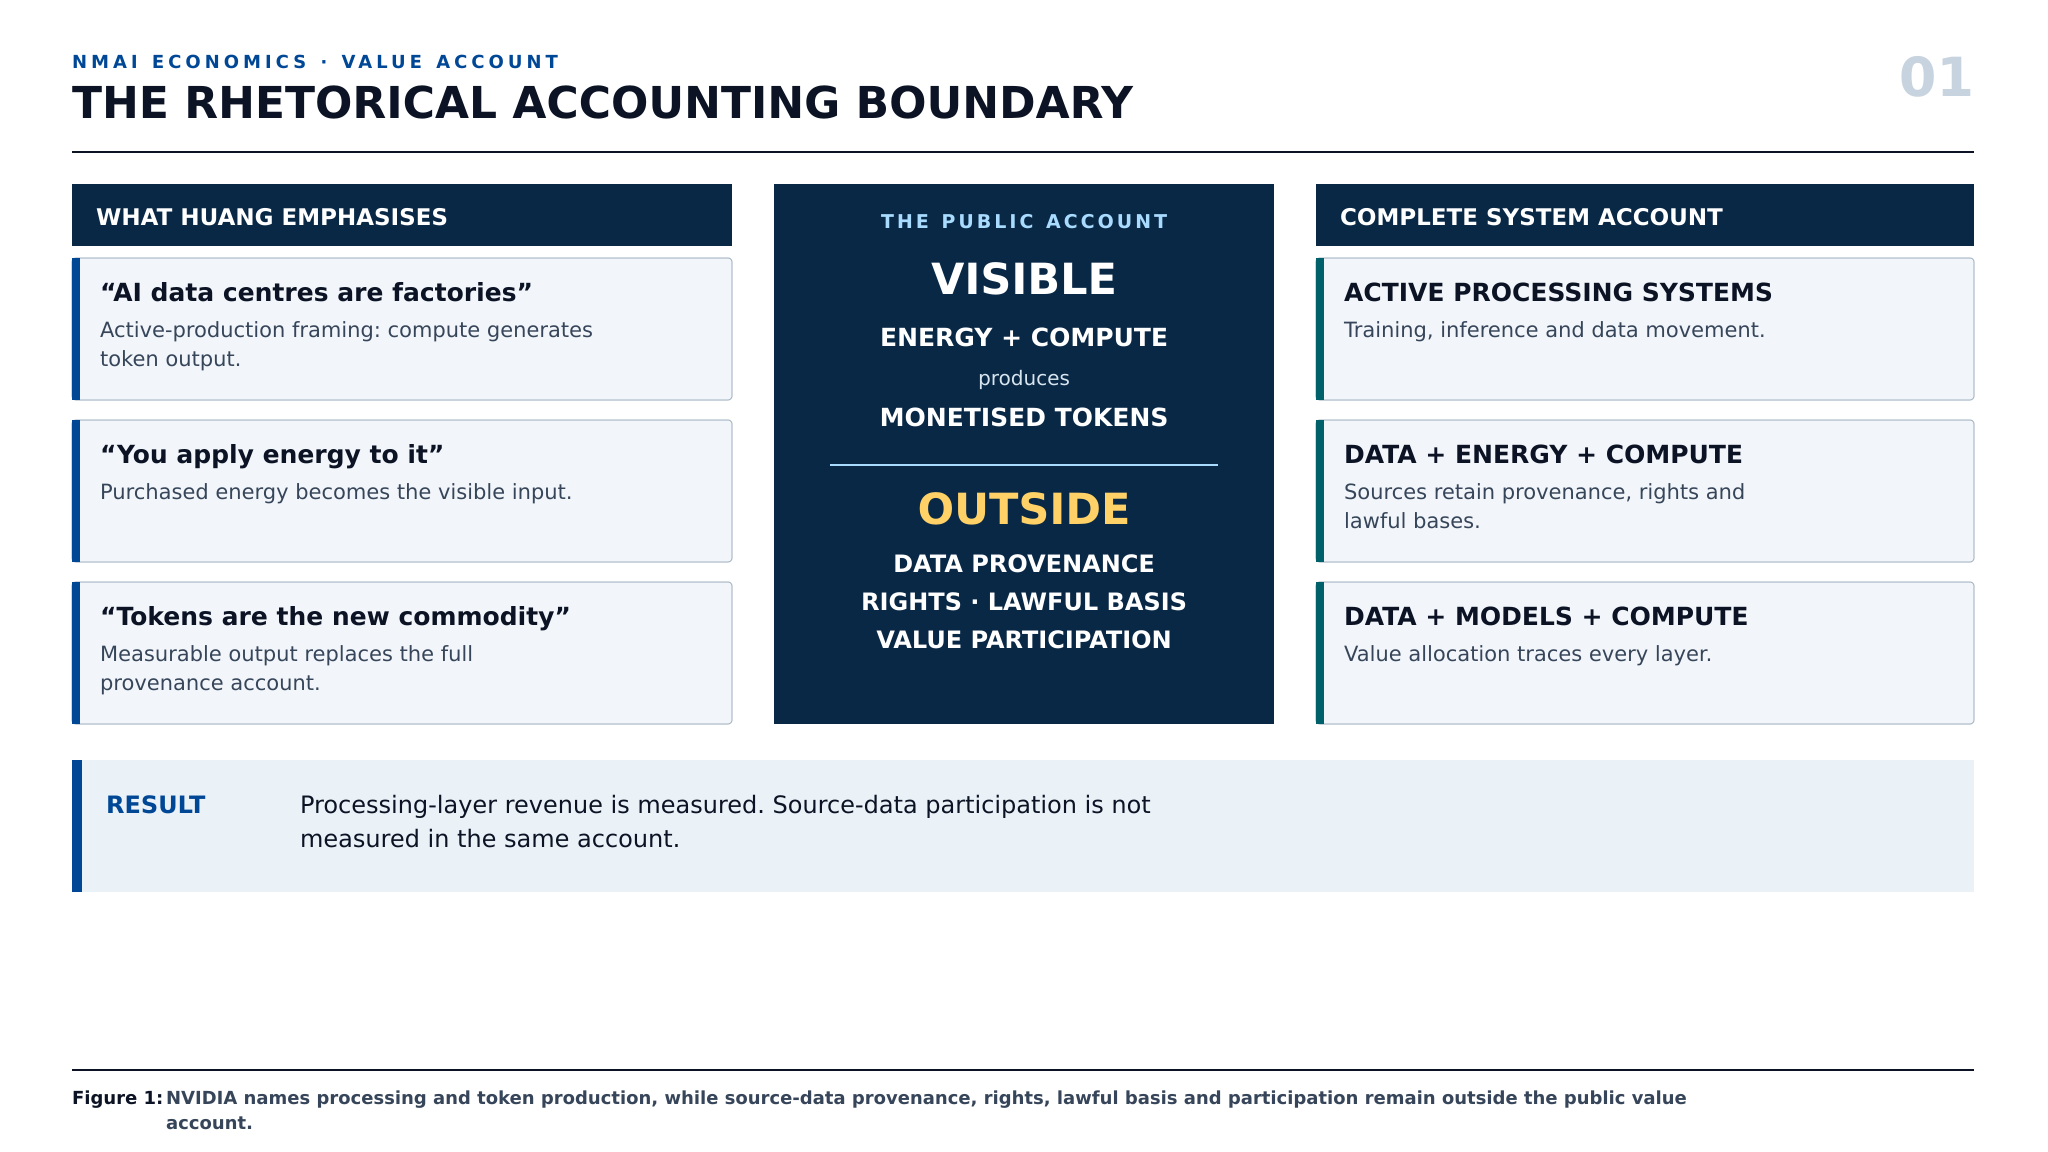
Evidential qualification: NVIDIA's public record also says that data is a raw material and that AI data centres actively produce tokens. Figure 1 should therefore be read as an NMAI critique of incomplete provenance and value accounting, not as evidence that NVIDIA literally describes modern AI infrastructure as passive storage.
2. The Three-Layer Extraction Architecture
NVIDIA's business model operates across three layers. The public value narrative centres the processing layer and its outputs. The following diagram shows the data and value flow examined by this paper, with the resource layer's provenance, rights and value participation outside that production account.
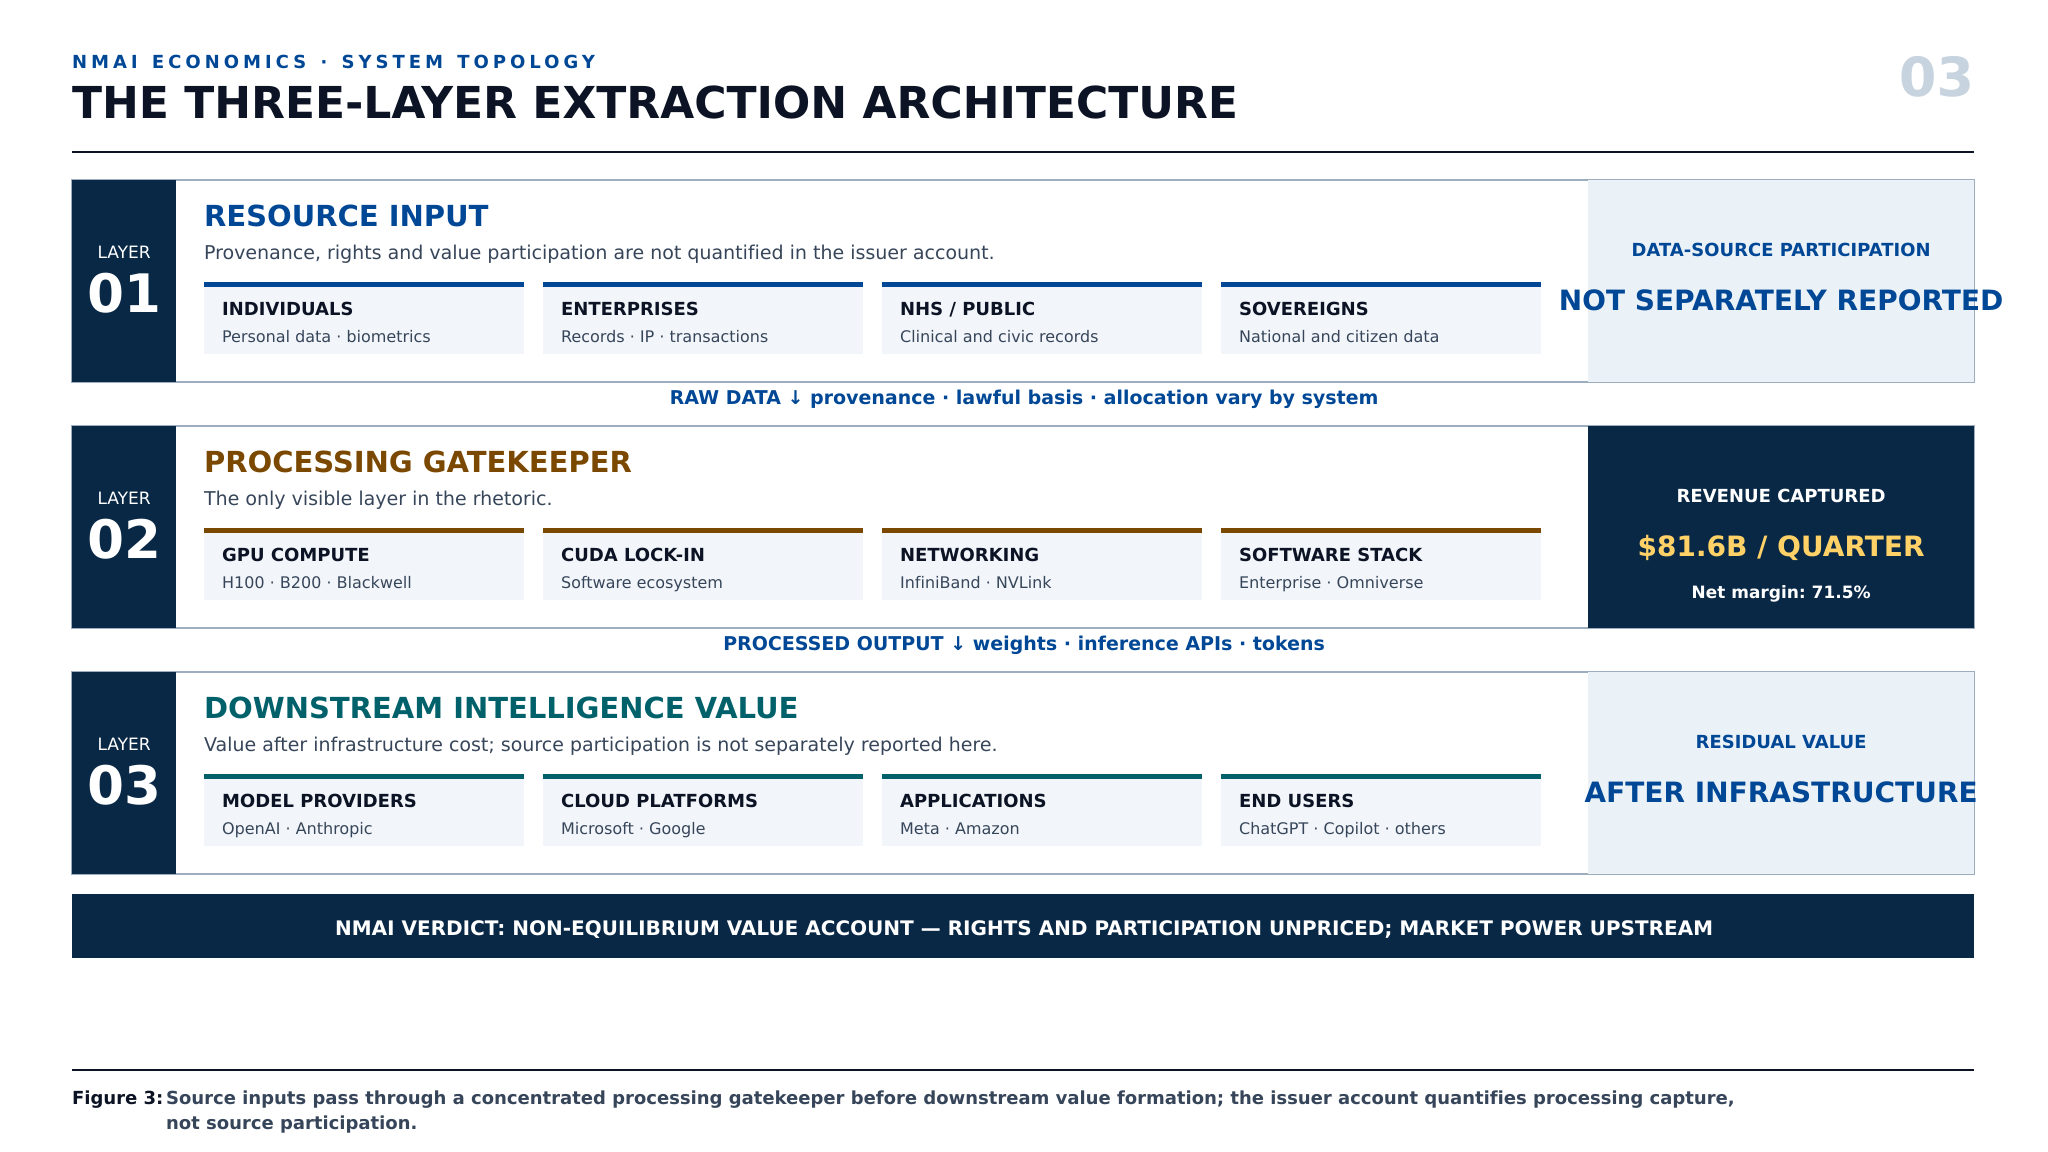
Figure 2: The Three-Layer Extraction Architecture — Data moves from varied sources through the processing layer to downstream model and application uses. The public value account quantifies the processing layer but not source-data provenance, rights or participation.
3. Quantitative Evidence: The Extraction Premium
3.1 Margin Progression — Evidence Relevant to Market Power
3.2 Revenue Trajectory — The Extraction Curve
3.3 The Compensation Gap — Visualising the Extraction Imbalance
4. NMAI Equilibrium Analysis
4.1 Equilibrium Score Visualisation
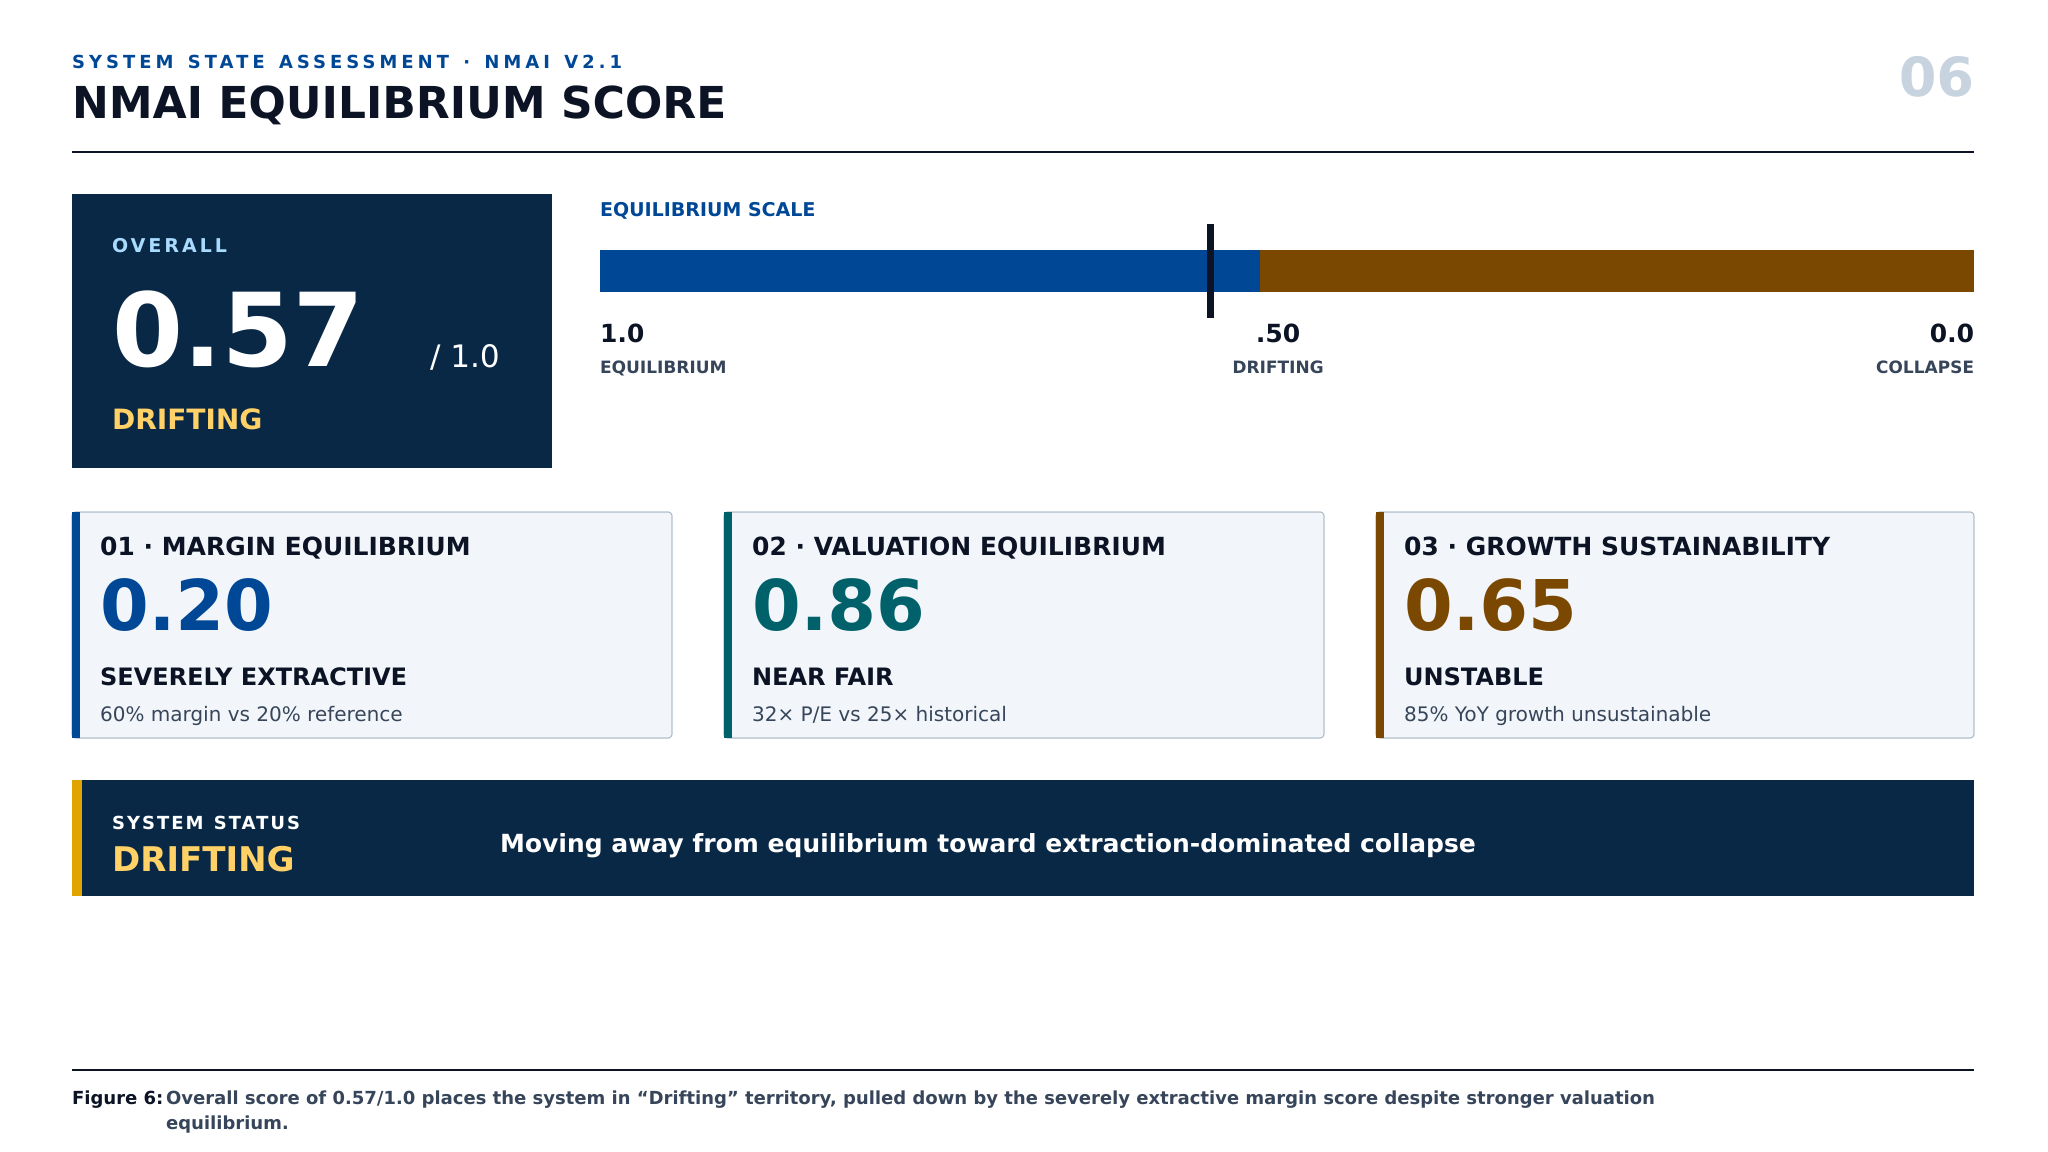
Figure 6: NMAI Equilibrium Score Gauge — Overall score of 0.57/1.0 places the system in "Drifting" territory, pulled down by the severely extractive margin score (0.20) despite reasonable valuation equilibrium (0.86).
Reproducibility note — case-study score
The 0.57 result is an equal arithmetic mean of three case-study indicators. The reference values and scaling denominators below are operational assumptions for this NVIDIA analysis; they are not universal constants of the foundational NMAI framework.
EM = 1 − (60 − 20) / 50 = 0.20
EV = 1 − (32 − 25) / 50 = 0.86
EG = 1 − (85 − 50) / 100 = 0.65
Eoverall = (0.20 + 0.86 + 0.65) / 3 = 0.57
4.2 Signal Integrity Rating — The Rhetorical Distortion Matrix
Visible-channel rubric: 0.0 = absent from the examined value narrative; 0.3 = the input is named but provenance, rights and allocation remain materially incomplete; 0.6 = the operational process is substantially named but the source-data account remains incomplete; 1.0 = the channel is carried through from input and authorisation to output and value allocation. The four channels are equally weighted for this case study.
4.3 Systemic Drift Vector — Three-Dimensional Trajectory
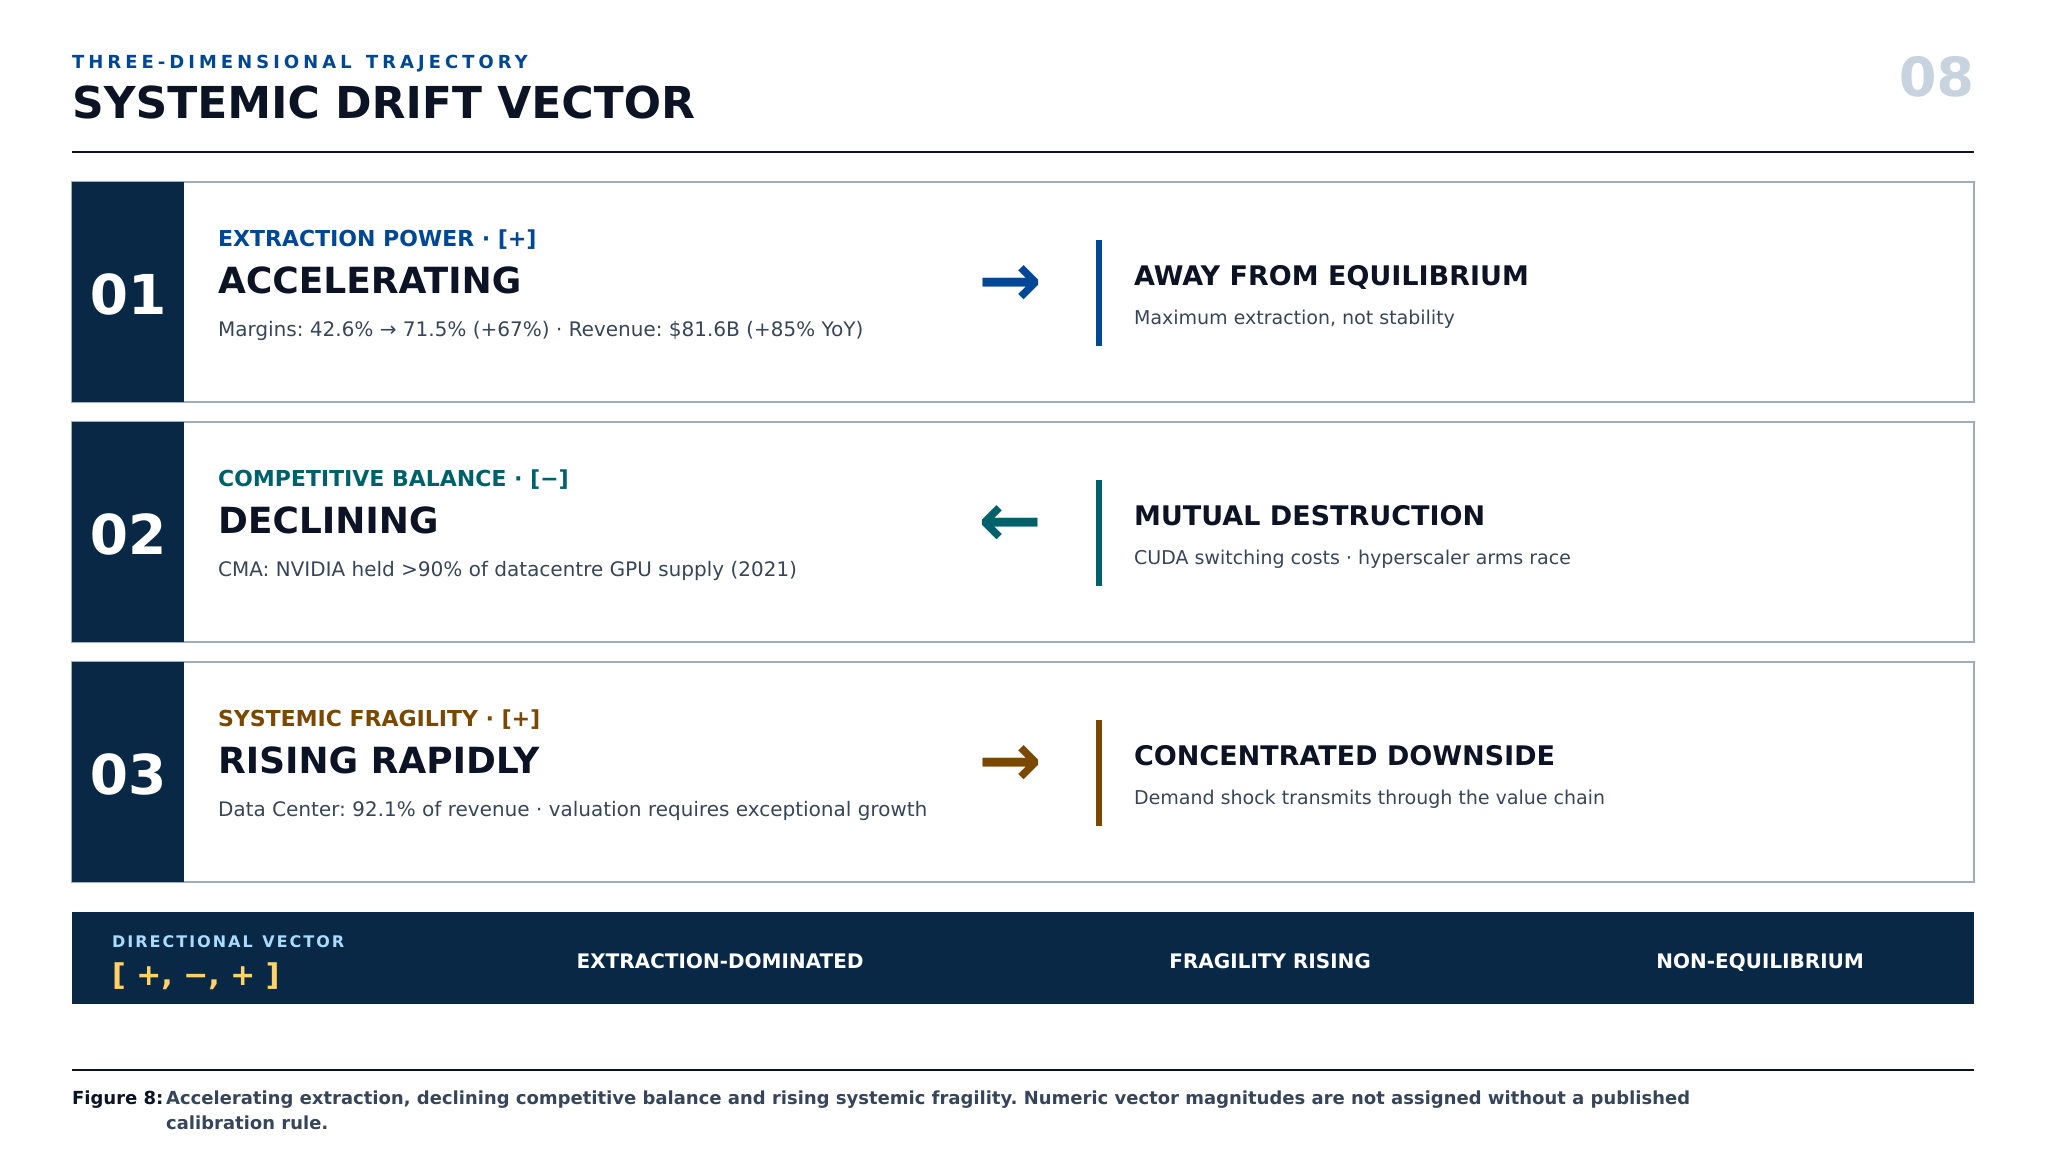
Figure 8: Systemic Drift Vector — Directional trajectory showing accelerating extraction, declining competitive balance, and rising systemic fragility. Numeric magnitudes are not assigned without a published calibration rule.
Calibration boundary: The observed direction of movement is retained as [+, −, +]. Earlier numeric magnitudes were removed because the supplied evidence did not contain a reproducible normalisation function for those three axes.
4.4 GAIEM: Scale Is Not an Accuracy Metric
The extraction economy is promoted through an assumed chain: more data-centre capacity produces more compute; more compute produces larger models; larger models produce better intelligence. The NashMarkAI GenAI Evaluation Matrix (GAIEM) tests the last step at the behavioural layer. It does not accept model size, context-window length, infrastructure expenditure or successful text generation as evidence of accuracy. It preserves the raw conversation, retransmits the complete accumulated transcript, and scores the resulting behaviour.
| Test condition | Measured evidence | Result | Structural meaning |
|---|---|---|---|
| Conversation input | Complete accumulated user-and-assistant transcript retransmitted on every turn | Available throughout | Context availability was controlled; it cannot explain the later omissions. |
| Execution integrity | Four independent sessions × nine turns | 36/36 responses; 0 provider or evaluator execution errors | The measured failures were behavioural results, not failed requests. |
| Cumulative state retention | Four explicit reconstruction probes | 0/4 passed; 41.2% macro mean | The model received the state but did not reliably reconstruct it. |
| Pooled factual recall | 46 configured facts across the four probes | 17/46 recalled; 37.0% | Capacity to hold a transcript did not become effective factual coverage. |
| Failure character | Configured contradiction and invention checks on the recall probes | 0 contradictions or inventions | The dominant failure was omission: apparently coherent output can still be materially incomplete. |
GAIEM finding: Scale is not evidence of accuracy. In the measured baseline, full transcript availability and successful response generation did not produce reliable cumulative-state retention. The current v0.1.0 evidence is an empirical result for one Llama 3.2 configuration, not a cross-model scaling law. A cross-model claim requires identical GAIEM runs across the larger model profiles already defined in the technical specification. The point already established is narrower and decisive: parameter count, context capacity and infrastructure scale cannot substitute for measured behavioural accuracy.
Open the full GAIEM module on NashMarkAI Inspect and run the GAIEM repository
5. The Five Rhetorical Devices of Extraction
Based on analysis of Huang's public statements (earnings calls, keynotes, investor presentations, media interviews), we identify five systematic rhetorical devices. Each device is mapped to its structural function and counter-frame.
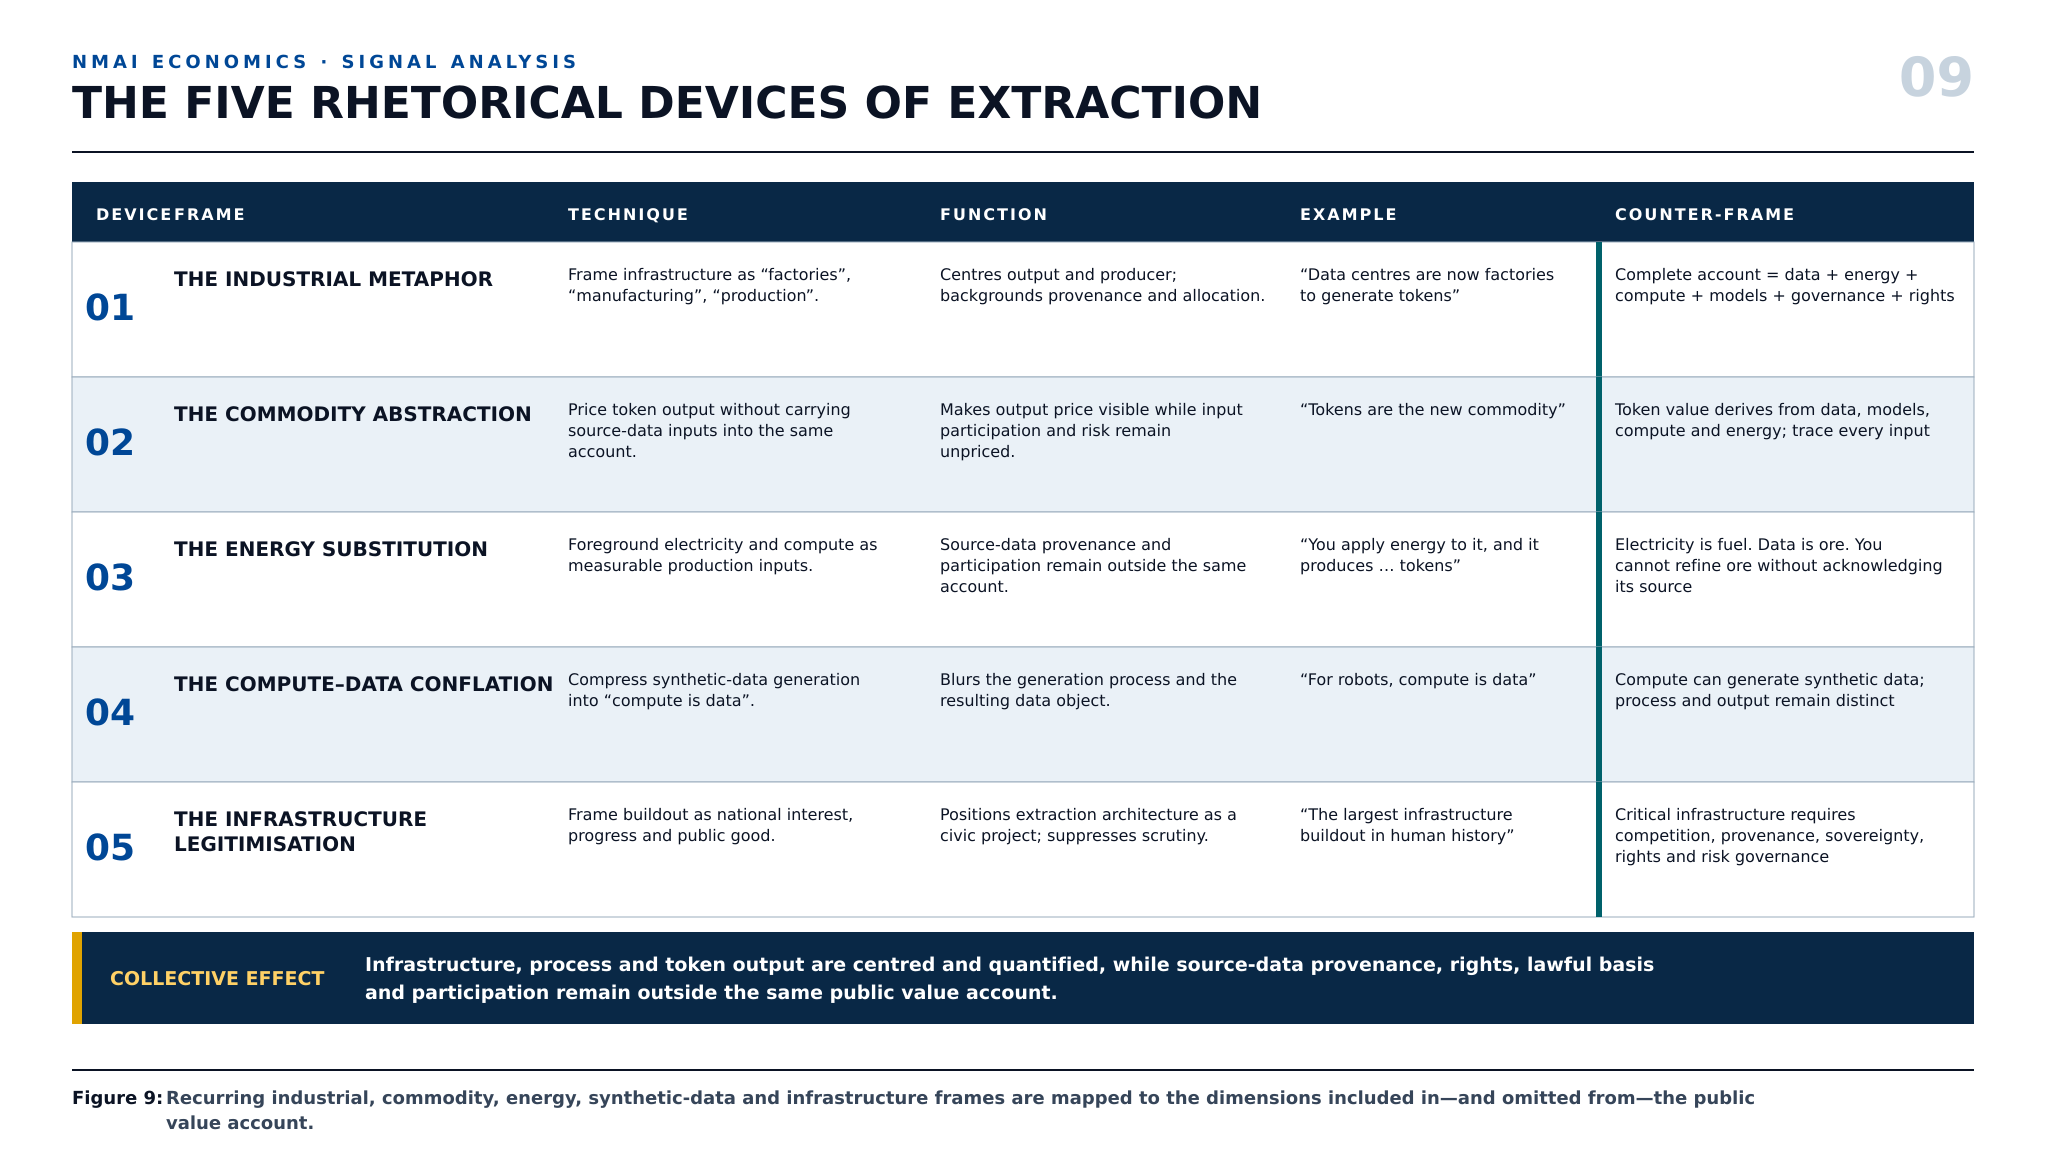
Figure 9: Five Rhetorical Devices — Recurring industrial, commodity, energy, synthetic-data and infrastructure frames mapped to the dimensions included in, and omitted from, the public value account.
6. The Data Sovereignty Implications
6.1 What Must Remain Sovereign
A sovereignty audit must follow every data object created by the system, not merely identify the building that holds the original database. The following separation prevents a claim of "local data" from concealing external access, processing or derivative capture:
| Data object | Evidence of sovereign retention | Evidence of farming or loss of effective control |
|---|---|---|
| Original records | Named controller; known location; defined lawful purpose; controlled access; enforceable retention and deletion. | Undisclosed access, replication, pooling, onward transfer or processing for a provider's separate purpose. |
| Working copies and caches | Task-limited creation; complete inventory; automatic expiry; deletion that can be independently verified. | Persistent copies, opaque backup chains, cross-customer aggregation or retention after the originating task ends. |
| Prompts, logs and telemetry | Minimum necessary collection; local control; explicit purpose; no unrelated product-improvement use. | Provider reuse for monitoring, product development, profiling, training or commercial intelligence outside the original purpose. |
| Embeddings, indexes and profiles | Treated as governed derivatives; exportable, inspectable, correctable and deletable with the source data. | Held in a provider-controlled vector store or profile system that persists after the source record or contract is removed. |
| Model learning | No training unless specifically authorised; training scope and resulting model changes are documented and governed. | Source information contributes to fine-tuning, gradients, weights or cross-customer model improvement that cannot be isolated or removed. |
| Synthetic data and outputs | Provenance is preserved; derivative rights, risks, permitted uses and value allocation remain under the originating governance boundary. | Derived datasets, tokens, analytics or products are treated as provider-owned output detached from the people and institutions that supplied the productive input. |
The decisive question is therefore not simply "Where is our database?" It is: "Who can use the data and its derivatives, under whose law, for which purposes, for how long, with what audit trail, and who keeps the resulting value?" If the originating institution cannot answer and enforce each part, physical localisation has not produced operational sovereignty.
Legal boundary: "Data sovereignty" is used here as an NMAI operational and economic definition, not as a single statutory term. For personal data in the United Kingdom, the legal analysis must separately establish controller and processor roles, lawful basis, transparency, purpose limitation, data minimisation, storage limitation, security, accountability and any restricted international transfer. The ICO treats making personal data accessible to a separate organisation outside the UK as a transfer question even where the data has not simply been shipped as a file.
6.2 The Consent Vacuum
NVIDIA's public material does acknowledge active processing and, in some statements, data as a raw material. That language does not establish the lawful basis, transparency, purpose limitation, provenance, controller/processor allocation or data-subject rights applicable to any particular dataset. Marketing terminology cannot prove either compliance or breach; those questions require the actual processing records and legal basis for each system.
6.3 The Ownership Obfuscation
The factory metaphor centres the producer and its output. It does not resolve the legal position of the underlying data. In UK law, personal data should not be reduced to a simple property claim: data subjects hold statutory rights, while controllers and processors carry defined obligations. The NMAI concern is therefore an accountability gap, not a legal vacuum: the production narrative does not show whose data was used, which rights attach, what lawful basis applies, or how value and risk are distributed.
6.4 The Compensation Gap
The NMAI economic proposition is that contributors to a productive resource layer should be visible within the system's value account. NVIDIA's issuer-level financial statements quantify corporate revenue, costs and profit, but they do not disclose a separable measure of source-data participation. The evidential finding is therefore an accounting absence, not proof that every data subject received zero compensation in every downstream system.

Figure 10: NVIDIA Revenue Disposition – 71.5% of Q1 FY2027 revenue remained as GAAP net income; 28.5% covered the difference between revenue and net income. Source-data participation is not a separable line item in this issuer-level account.
7. Conclusion: The NMAI Verdict
The NVIDIA case study demonstrates how the NMAI framework detects structural extraction that is invisible to conventional financial analysis. The framework reveals three critical findings:
Figure 11: Final Verdict Dashboard — Three critical findings. The paper identifies systematic substitution of passive/storage metaphors for active-processing and extraction effects across a market valued at approximately $5T.
This is not a semantic quibble. It is a structural accounting problem. A market capitalised at approximately $5 trillion measures compute throughput, revenue, margin and token output in detail, while the same public account does not trace source-data provenance, case-specific lawful basis, data-subject rights or participation in the value created. That absence is the paper's NMAI finding. It is not, without the underlying processing records, a determination that every downstream dataset was unlawfully obtained or that every data subject was legally entitled to payment.
The sovereignty consequence is exact: data kept is not necessarily data sovereign. The original file may remain in its source database while its contents, metadata, inferences, embeddings, model effects and economic value are extracted into systems controlled elsewhere. Any infrastructure claim that identifies only the server location but does not account for access, processing, derivatives, jurisdiction, audit, deletion, exit and value retention is incomplete. That is the difference between hosting data and governing it—and between a data centre as infrastructure and a data farm as an extraction function.
Sources and Cross-References
- NVIDIA, Computex 2025 keynote report — Huang's statement that AI data centres are more accurately described as factories that apply energy to produce tokens.
- NVIDIA GTC 2026 keynote — primary video and transcript source for "tokens are the new commodity."
- NVIDIA, AI Data Platform announcement — Huang's express statement that data is a raw material in the age of AI.
- NVIDIA, Davos 2026 — the "largest infrastructure buildout in human history" and five-layer framing.
- NVIDIA, Physical AI Data Factory Blueprint — the 2026 "compute is data" statement in its physical-AI and synthetic-data context.
- NVIDIA, First Quarter Fiscal 2027 financial results — $81.6B revenue, $58.321B GAAP net income and $75.2B Data Center revenue for the quarter ended 26 April 2026.
- NVIDIA, Fourth Quarter and Fiscal 2026 financial results.
- NVIDIA, Third Quarter Fiscal 2026 financial results.
- NVIDIA, Second Quarter Fiscal 2026 financial results.
- NVIDIA, First Quarter Fiscal 2026 financial results.
- UK Competition and Markets Authority, NVIDIA/Arm summary — the CMA's 2021 finding of market power and over 90% share of datacentre GPU supply.
- UK Information Commissioner's Office, Guide to the data-protection principles — lawfulness, fairness and transparency; purpose limitation; data minimisation; accuracy; storage limitation; security; and accountability.
- UK Information Commissioner's Office, Controllers and processors — roles, control and accountability under the UK GDPR.
- UK Information Commissioner's Office, International transfers — transfer rules covering both sending personal data and making it accessible to a separate organisation outside the UK.
- NashMark AI — A New Economic Equilibrium Paradigm.
- NashMark AI — Economic Equilibrium Simulations.
- Generative AI as a Non-Equilibrium System: Drift, Perturbation, and the Failure of Truth Convergence.
- GAIEM v0.1.0 — GenAI Evaluation Matrix.